
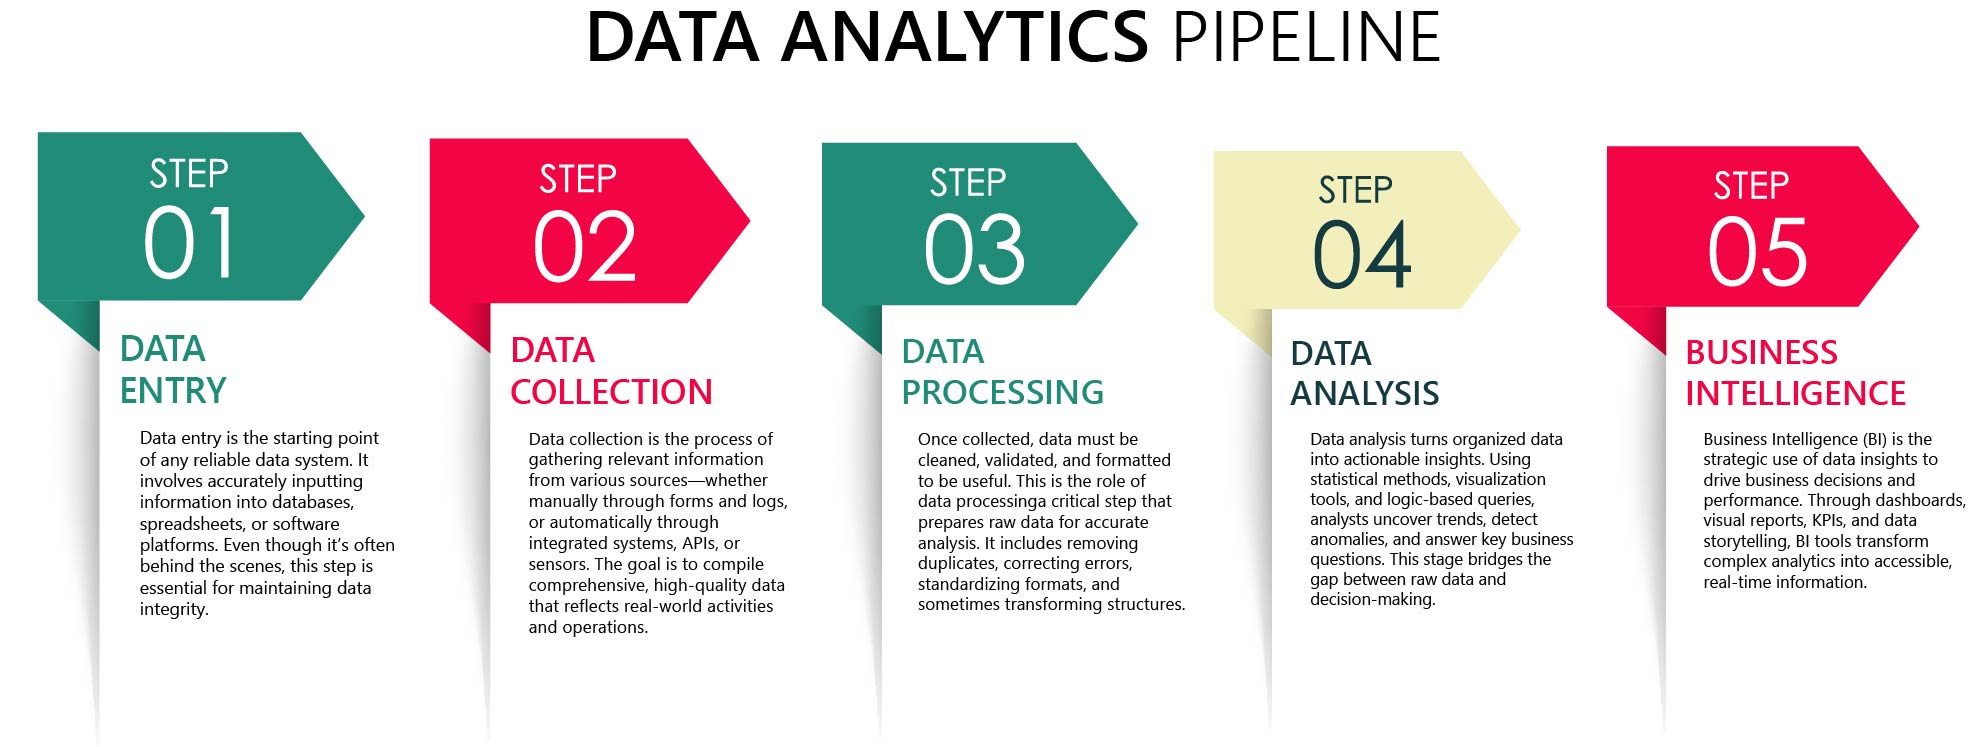
Importance of Data Analysis
Once your data has been collected, cleaned, and processed, the next critical step is analysis. This is the stage where raw numbers begin to tell a story patterns are revealed, anomalies are uncovered, and relationships between variables come into focus. Without this stage, even the most pristine datasets are just structured noise.
At its core, data analysis transforms facts into findings. Whether you’re optimizing operational workflows, enhancing customer experiences, or forecasting sales and market trends, analysis converts information into insight and insight into action. It’s the mechanism that bridges your data and your decisions, fueling growth, innovation, and competitive advantage.
But successful data analysis doesn’t happen by chance. It requires the right mindset, the right questions, and the right tools. Businesses today have access to a wide range of solutions, from simple spreadsheet applications to enterprise-grade platforms capable of processing millions of records in real time.
Common Tools Used in Data Analysis
- Microsoft Excel: Still a staple in many industries, Excel offers a balance of accessibility and capability. With functions like VLOOKUP, INDEX/MATCH, pivot tables, and Power Query, it’s an ideal starting point for small to mid-size datasets.
- Power BI: Power BI allows users to turn raw data into interactive dashboards and visualizations. Its deep integration with Excel and the Microsoft ecosystem makes it a top choice for teams looking to build self-service analytics environments.
- SQL (Structured Query Language): For analysts working with relational databases, SQL is essential. It enables users to extract, filter, and manipulate large datasets quickly and efficiently. Many modern BI tools are powered by SQL in the background.
- Python (Pandas, NumPy, Matplotlib, Seaborn): For more advanced analysis, Python offers immense flexibility. The Pandas library simplifies data wrangling, while visualization libraries like Matplotlib and Seaborn help generate detailed visual summaries. It’s an essential toolset for anyone involved in data science or automation.
- R Programming: Popular in academia and statistical analysis, R excels at handling complex statistical models. It’s a great tool for data scientists needing to run regressions, clustering, or hypothesis testing.
- Tableau: A strong competitor to Power BI, Tableau specializes in beautiful, interactive visualizations. It connects easily to multiple data sources and is favored in industries where presentation and interactivity are key.
- Google Looker (Looker Studio): Google’s entry into BI tools offers real-time dashboarding that connects well with cloud-based data warehouses like BigQuery. It’s especially common in digital marketing and eCommerce settings.
Key Benefits of Strong Data Analysis
Strong data analysis enables businesses to make informed decisions backed by evidence, not assumptions. It uncovers patterns and trends that reveal opportunities for growth, efficiency, and innovation. By identifying risks early, analysis helps organizations avoid costly mistakes and pivot with confidence. Ultimately, it transforms raw information into strategic insight that drives measurable outcomes.
Clarity and Focus
Data analysis helps businesses zero in on what’s happening, versus what they assume is happening. It replaces guesswork with grounded insight, allowing organizations to make informed decisions rooted in evidence. In today’s fast-moving landscape, assumptions can be costly, leading to missed opportunities, wasted resources, or flawed strategies. Data analysis cuts through the noise by systematically identifying patterns, trends, and outliers that might otherwise go unnoticed. It surfaces the underlying dynamics of customer behavior, operational performance, and market conditions. With this clarity, businesses can challenge outdated narratives, validate or reject hypotheses, and refine their approach based on what the data truly reveals not just what they expect it to say.
Say for instance, a retail company may assume their in-store promotions are driving increased weekend sales. But after analyzing sales data, customer traffic, and point-of-sale records, they discover that most purchases are influenced by email campaigns sent mid-week. This insight allows the company to shift marketing spend away from expensive in-store signage and toward targeted email content, boosting ROI and reducing unnecessary costs. With analysis, they didn’t just confirm a hunch they discovered the real driver behind their results.
Performance Tracking
Data analysis helps businesses zero in on what’s actually happening, versus what they assume is happening. It provides clarity in complex environments by distinguishing meaningful signals from background noise. Rather than relying on intuition or anecdotal observations, organizations can base decisions on concrete evidence and measurable performance indicators. Analysis highlights emerging trends, recurring patterns, and anomalies that may point to deeper issues or untapped opportunities.
By examining the data from multiple angles whether through statistical methods, visual dashboards, or predictive models businesses can uncover the “why” behind the “what.” This deeper understanding empowers leaders to act with confidence, refine strategy, and measure outcomes more effectively. In essence, analysis turns a collection of facts into a powerful narrative that guides smarter, more strategic decision-making.
Informed Decision-Making
Data-backed decisions reduce guesswork and mitigate risk. When decisions are grounded in analysis rather than assumptions, businesses can move forward with greater confidence and clarity. By studying historical performance, forecasting potential outcomes, and identifying leading indicators, leaders gain a clearer picture of what’s likely to happen before taking action. This is especially crucial during periods of growth, restructuring, or strategic pivots, where the cost of error can be high.
Instead of reacting to problems after they occur, data analysis equips teams to anticipate challenges and proactively address them. It also supports more objective, transparent decision-making ensuring that changes are based on measurable impact rather than gut instinct. Whether allocating resources, entering new markets, or shifting internal processes, analytical insights provide a critical layer of validation that strengthens planning and execution.
Foundation for Automation & AI
You can’t automate or predict what you don’t understand. Consistent, high-quality analysis is the foundation for any advanced data initiative. Before any predictive model or automation system can be developed, a deep understanding of the data is required how it’s structured, how it behaves over time, and what it truly represents. Without this groundwork, AI and machine learning tools are likely to produce inaccurate, biased, or unreliable outputs.
By establishing a culture of rigorous analysis, organizations create reliable datasets that machine learning models can be trained on. Patterns must first be discovered and validated manually before they can be trusted to be replicated algorithmically. In this way, analysis acts as a bridge between traditional reporting and intelligent automation transforming data from something informative into something transformative.
Common Pitfalls to Avoid
Relying on incomplete or poor-quality data can lead to misleading conclusions and flawed strategies. Ignoring context or over-analyzing without a clear objective often results in wasted time and resources. Without proper validation, even the most advanced analysis can steer a business in the wrong direction.
Analysis Without Context
Numbers mean little without business context. Ensure you’re asking the right questions and tying your analysis back to objectives.
Overcomplication
Not every data set needs a dashboard. Prioritize clarity. Simple visualizations and clear narratives often drive more action than over-engineered reports.
Skipping Human Insight
Tools can crunch data, but human judgment is critical. Use data analysis as a compass, not a replacement for business expertise.
Data analysis is more than a reporting function it’s a strategic tool. When done right, it empowers organizations to act faster, smarter, and with greater confidence.
Stay tuned for the final entry in our series: The Importance of Business Intelligence where we explore how to tie everything together to create a system that delivers real-time, actionable insights.