Microsoft Excel Case Study-01
Case Study Coffee Shop Analysis
Case Study Coffee Shop Analysis
New York is home to thousands of coffee shops; each competing to attract and retain customers in a fast-paced urban environment. In such a competitive market, leveraging data analysis can be a game-changer. By understanding sales trends, customer preferences, and operational efficiencies, a coffee shop can optimize its business strategy and increase profitability.
Project Overview
This data analysis project was undertaken by one of our developers to display a quick analysis within Microsoft Excel. A new coffee shop owner with three locations in the New York City area provided sales data from the first half of 2023. The goal was to transform the raw data into a simple, interactive dashboard that the owner and colleagues could use to identify trends and business opportunities. Key objectives included:
- Profiling and preparing the raw data for analysis.
- Exploring the data using Microsoft Excel Pivot Tables.
- Building and designing a dynamic dashboard to visualize patterns and trends.
- Generating insights and recommendations for future business improvements.
Understanding Sales Trends
One of the first steps in data analysis is examining sales patterns. By collecting and analyzing data from point-of-sale (POS) systems, a coffee shop can identify:
- Peak hours of operation.
- Best-selling products.
- Seasonal variations in demand.
- Customer purchase frequency.
Customer Preferences and Behavior
Beyond sales numbers, understanding customer preferences is crucial. By analyzing loyalty program data, surveys, and social media interactions, a coffee shop can determine what are the most popular drink combinations, what can be potentially preferred seating arrangements (e.g., to-go orders vs. dine-in customers). Specific demographics of frequent visitors and price sensitivity and promotional effectiveness.
If data indicates that customers often purchase a croissant with their coffee, the shop can create bundled promotions to increase sales. Additionally, tracking online reviews and social media engagement can highlight areas for improvement in customer service or product offerings. Understanding customer demographics, such as age and occupation, can also help tailor marketing messages and special offers to different audience segments, improving engagement and retention.
Operational Efficiency and Cost Management
Data analysis also plays a key role in optimizing operations. By evaluating inventory data, supply chain costs, and waste management, a coffee shop can reduce overhead expenses. Paying attention to things like minimizing ingredient waste by predicting demand more accurately can help improve efficiency. Negotiating better supplier contracts based on historical purchasing trends and adjusting menu pricing to reflect cost fluctuations can also be factors to take into consideration.
Now if a shop notices an increase in milk waste, implementing a real-time inventory tracking system can help reduce excess ordering and improve cost control. Additionally, identifying inefficiencies in supply chain logistics can lead to better vendor agreements and lower costs. Labor optimization can also be improved by analyzing employee schedules alongside peak customer traffic data, ensuring adequate staffing without excessive labor costs.
Interactive Excel Dashboard
This interactive Excel dashboard was designed to analyze and visualize key performance metrics for the coffee shop. Using transactional sales data, it provides insights into customer behavior, sales trends, and operational efficiency. By centralizing key performance indicators (KPIs) in a single interface, the dashboard allows business owners to make informed decisions quickly and efficiently.
Key Features:
- Sales Analysis: Tracks daily, weekly, and monthly revenue with dynamic charts, allowing easy comparison of performance over different time periods.
- Popular Items Report: Identifies the best-selling beverages, highlighting location trends to help with targeted promotions and product stocking decisions.
- Peak Hour Insights: A time-based analysis reveals the busiest hours, helping with staffing and inventory planning to ensure smooth operations during high-traffic periods.
- Profitability Metrics: Displays revenue breakdowns and transaction values, helping business owners assess which products and locations contribute most to profitability.
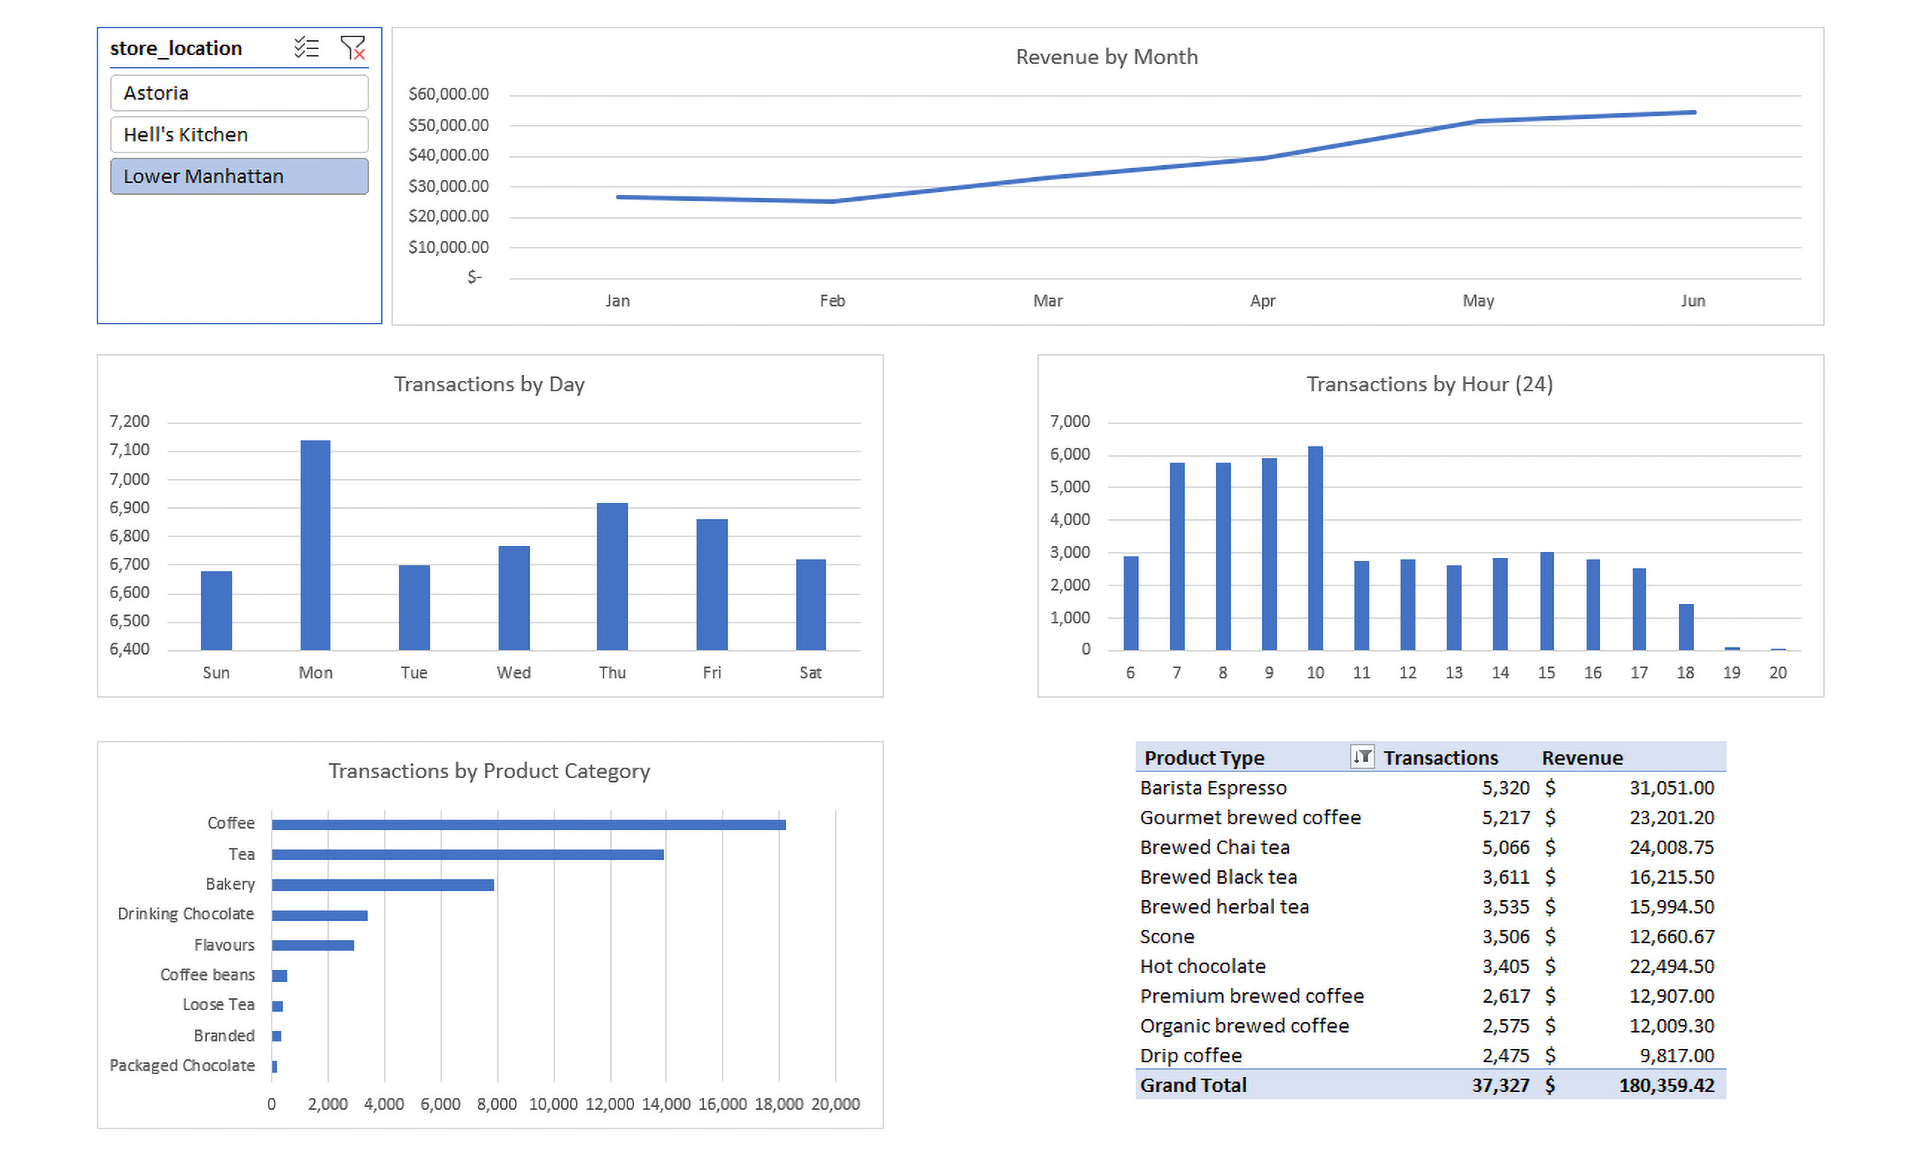
Built with PivotTables, the dashboard enables quick updates and interactive data exploration, helping the coffee shop make data-driven decisions for improved efficiency and profitability. The ability to filter data by date range, location, and product category enhances usability, ensuring the owner can extract relevant insights effortlessly.
Marketing and Personalization
A data-driven marketing approach allows a coffee shop to personalize promotions and customer interactions. By segmenting customers based on purchase behavior, targeted campaigns can be created, such as sending exclusive discounts to frequent buyers to enhance customer loyalty. Promoting seasonal drinks based on past purchase trends, ensuring customers are aware of new offers they are likely to enjoy. Utilizing geolocation data for hyper-local advertising, sending promotional messages to potential customers in proximity to the shop.
Sending SMS promotions to customers who haven’t visited in a month can incentivize them to return. Email marketing campaigns can be enhanced by offering personalized recommendations based on previous purchases. Social media engagement can also be improved by analyzing customer interactions, leading to more effective content strategies that resonate with the target audience.
In an ever-evolving market like New York, coffee shops that harness data analytics gain a competitive advantage. By analyzing sales trends, customer behavior, operational efficiency, and marketing effectiveness, coffee shop owners can make informed decisions that drive growth. Investing in the right tools and methodologies for data analysis can turn raw numbers into actionable strategies, ensuring long-term success in the bustling coffee industry. With a well-designed, interactive dashboard, coffee shop owners can continuously monitor performance, adapt strategies, and capitalize on emerging opportunities to stay ahead of the competition.