Microsoft Excel Case Study-03
Toy Store Analysis (Regional Revenue)
Toy Store Analysis (Regional Revenue)
At AnatoliaDev, we specialize in transforming raw data into meaningful insights that fuel smart business decisions. Recently, we had the opportunity to partner with a mid-sized toy company looking to better understand its regional sales performance and product trends. The result? A dynamic and user-friendly dashboard that’s now empowering their Regional Sales Managers and Executive team to make faster, data-driven decisions.
The dashboard was developed with both accessibility and strategic planning in mind. Executives now have a high-level overview they can trust that is updated automatically and accessible at any time. Meanwhile, sales managers use it in regular team meetings to guide actions and optimize local performance.
This project reflects AnatoliaDev’s mission: delivering tailored analytics solutions that bridge the gap between data and decision-making.
“Note: All data shown has been anonymized and modified to protect the identity and confidentiality of the client.“
A Dashboard Designed for Simplicity, Clarity and Impact
This comprehensive monthly dashboard equips Regional Sales Managers with a clear and interactive view of business performance. Built in Microsoft Excel, it provides key visualizations and controls to help leadership identify challenges and compare store and product performance immediately.
Key Features Include:
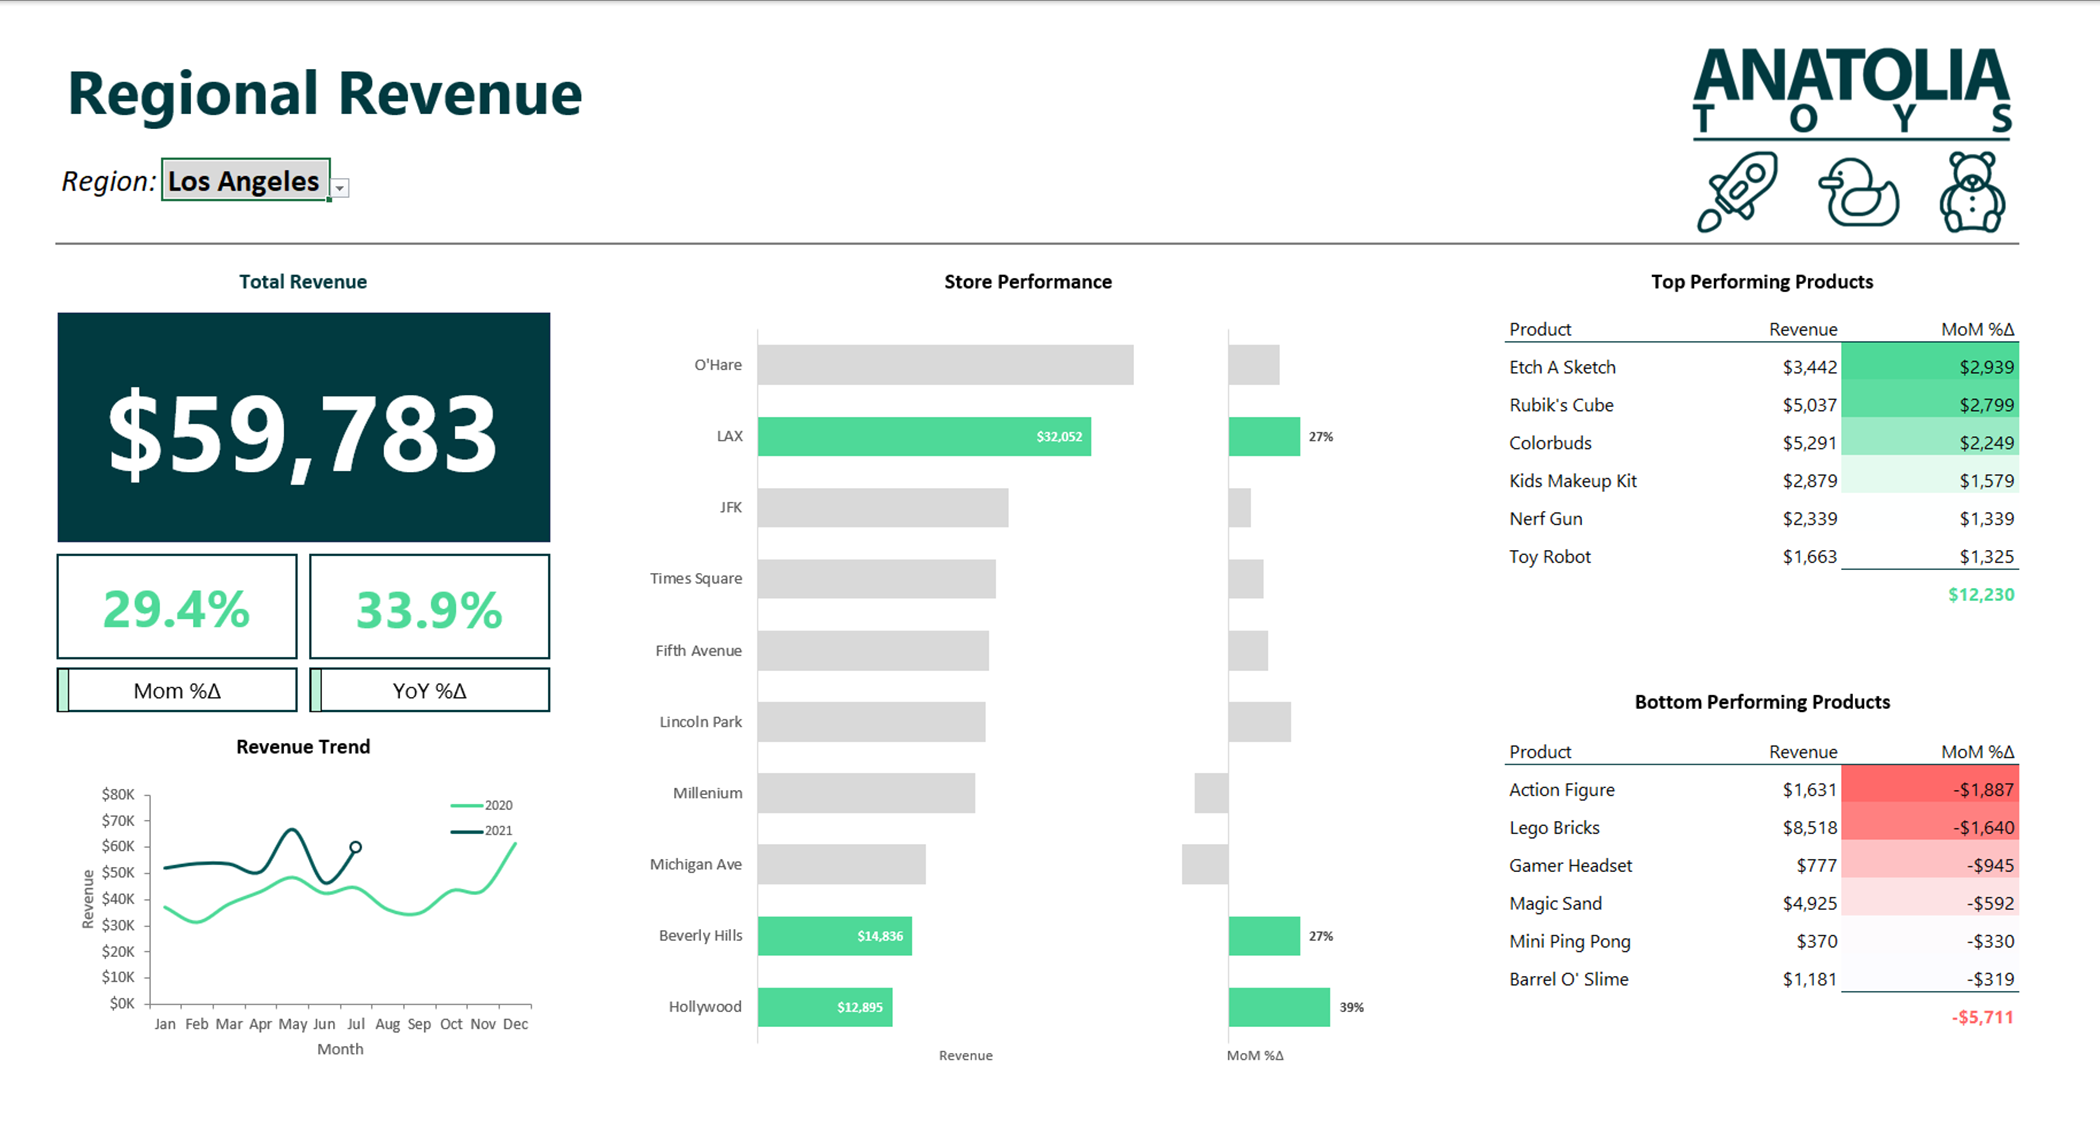
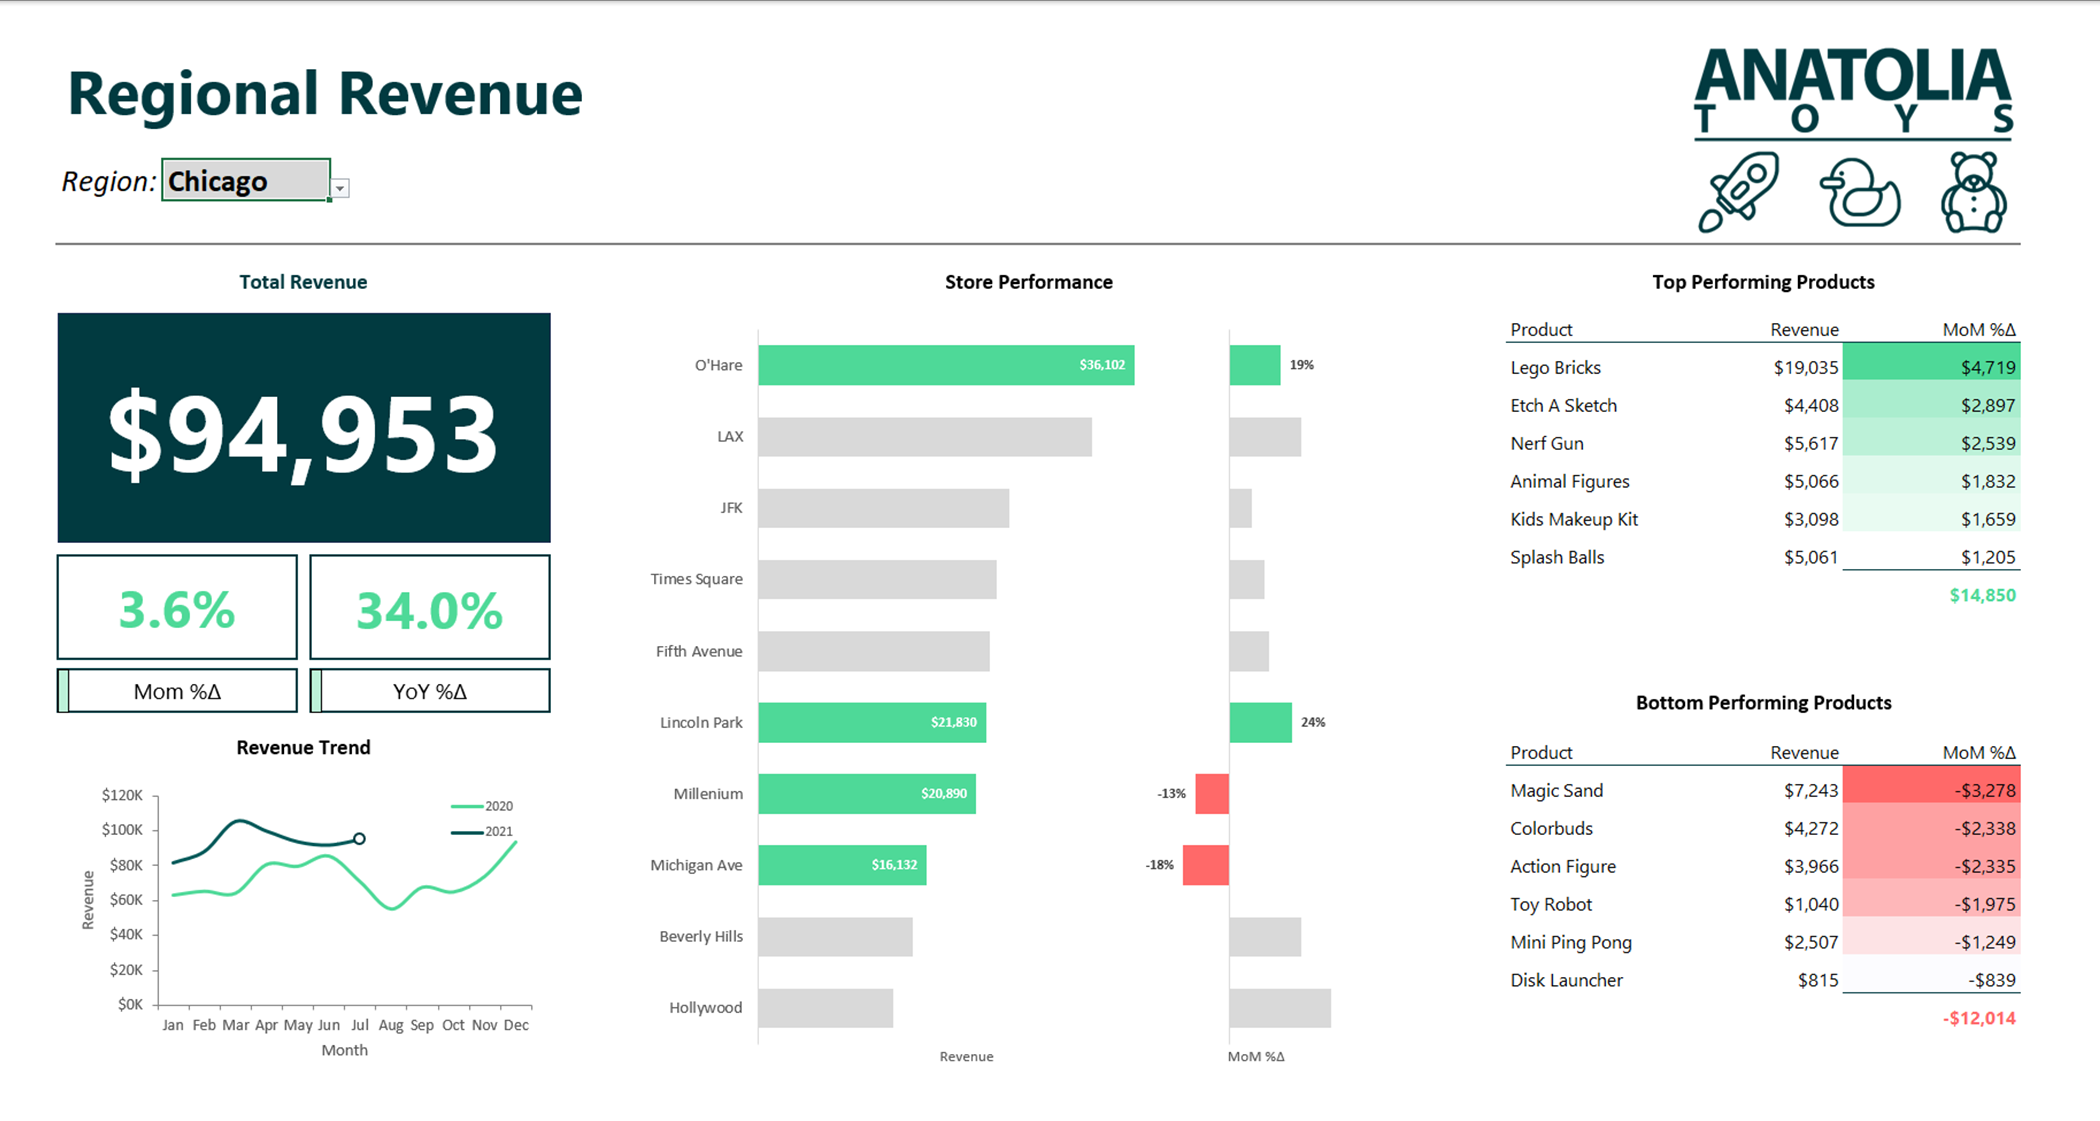
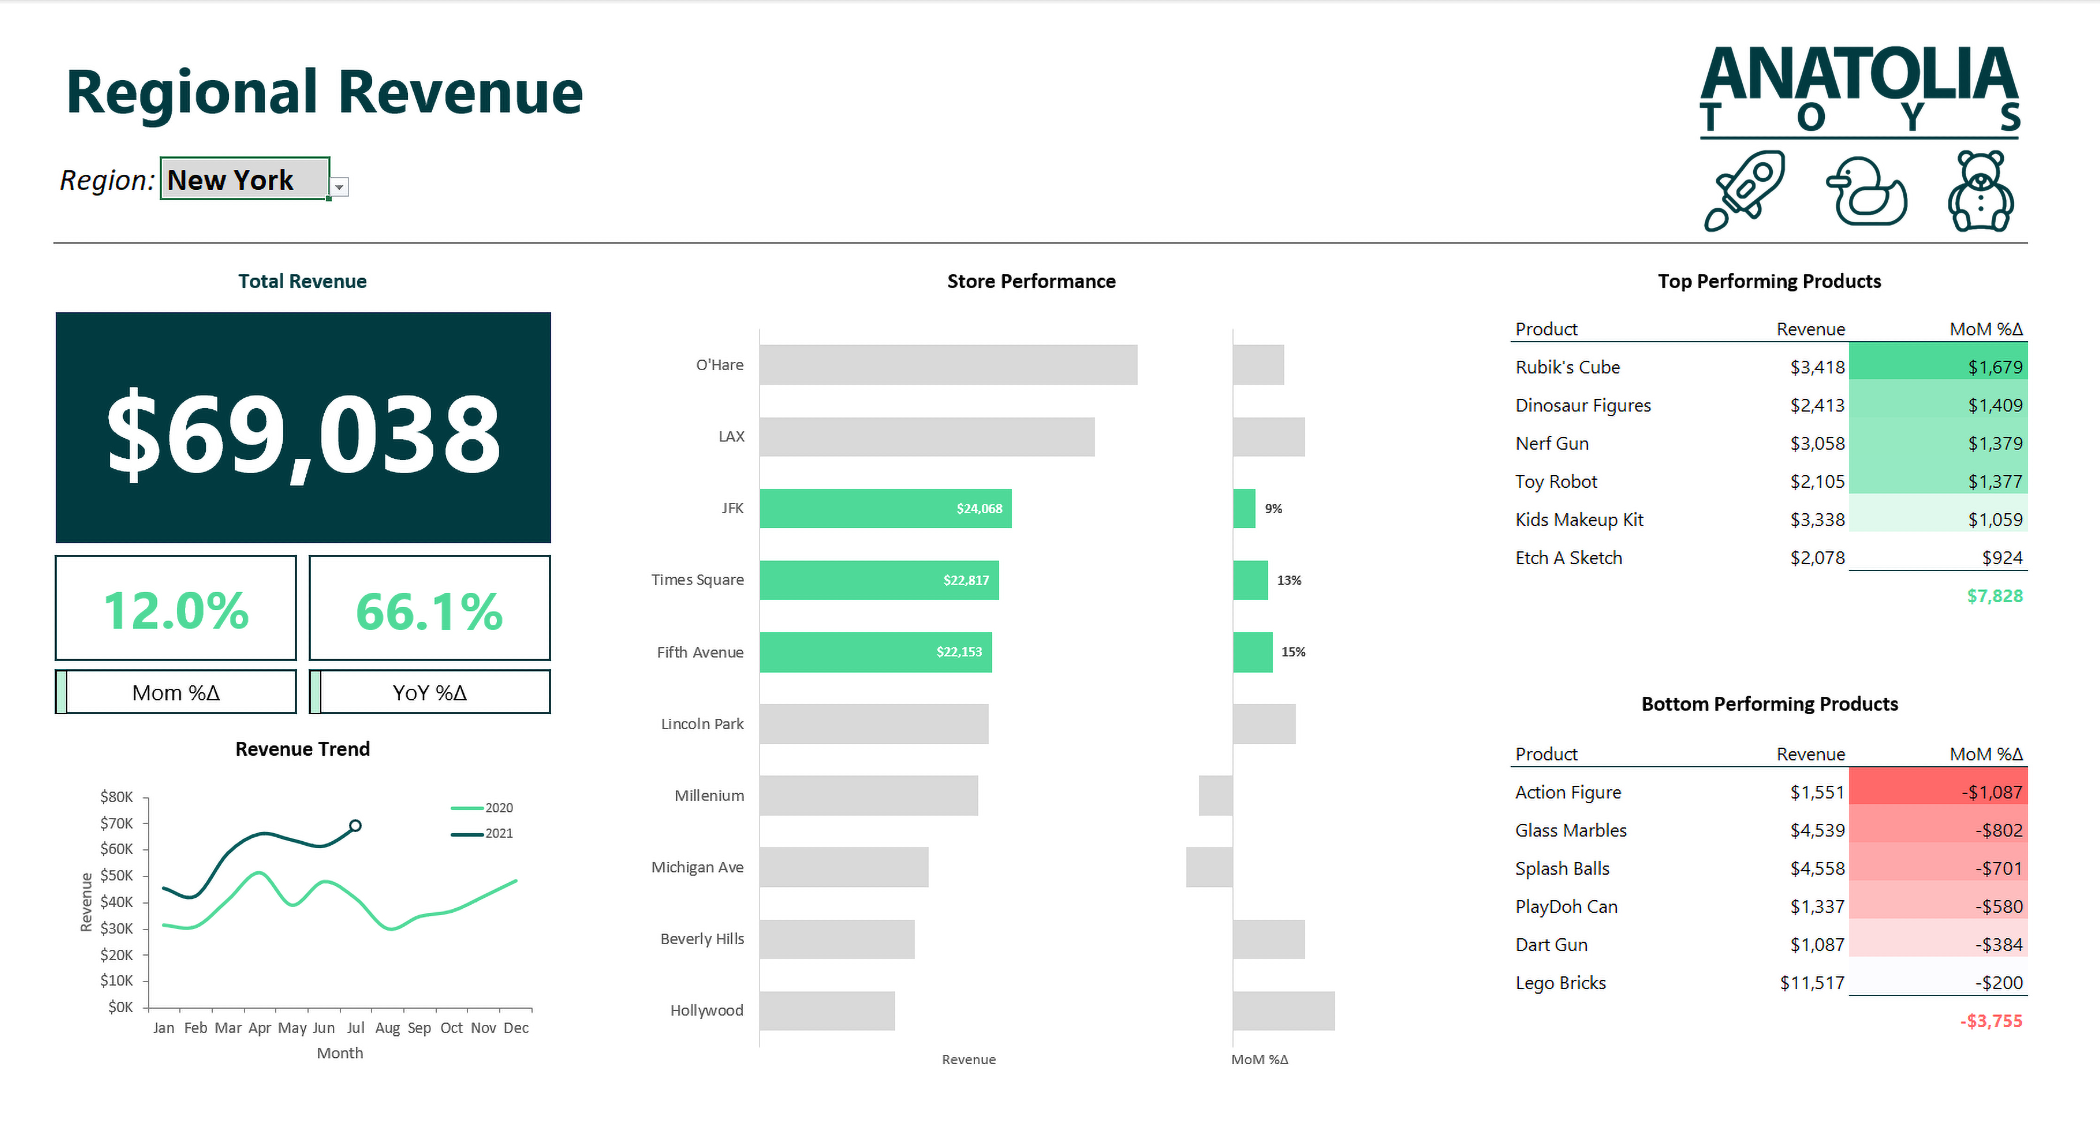
Region-Based Filtering: Managers can quickly isolate their own territory to analyze performance, while also benchmarking against other regions to uncover market differences or best practices. At the core of the dashboard is a user-friendly filter pane that allows Regional Sales Managers to narrow down performance data by geographic area. This interactivity enables each manager to focus solely on their specific territory while also viewing how their numbers stack up against other regions. By enabling comparisons, this feature fosters accountability across the sales team.
- Use Case: A manager in the Los Angeles region can quickly compare monthly performance against the Chicago region to identify gaps or growth strategies worth adopting.
Monthly Revenue Trends: Line charts display monthly revenue progression, making it easy to detect seasonal patterns, growth momentum, or early signs of decline. The revenue trends section visualizes monthly performance using interactive line charts. These charts not only show what happened but help answer why it happened by giving context to seasonal fluctuations or sales dips and helping leadership proactively respond.
- Use Case: Leadership noticed a mid-year dip across most regions. After reviewing the timeline, they correlated the drop with delayed shipments and adjusted future logistics planning.
- Use Case: A store showing 8% YoY growth might look successful at first glance—but when compared to a regional average of 15%, leadership knows there’s room for improvement.
Regional Comparisons: The dashboard also allows individual regional performance, supporting competitive benchmarking across the company’s retail footprint. This view displays each store’s key metrics side-by-side, enabling quick and comprehensive benchmarking.
Metrics Incluse:
- Monthly and Yearly revenue.
- Average transaction valueMonthly and Yearly revenue.
- Product PerformanceAverage transaction valueMonthly and Yearly revenue.
- Use Case: A flagship store underperforming relative to smaller branches prompted leadership to launch a local audit and retraining initiative.
Product Performance: The dashboard highlights top-selling toys and underperformers by revenue, providing insight into shifting customer preferences and inventory planning. Sales data is broken down by product name, and revenue impact, showing the best and worst performers for the selected period.
Users can see:
- Top 6 revenue-generating products.
- Products with the steepest month-over-month decline. Top 6 revenue-generating products.
- Sales distribution by product nameProducts with the steepest month-over-month declineTop 6 revenue-generating products.
This is especially valuable for seasonal product lines and inventory planning. Underperforming items can be flagged early and adjusted in future purchasing decisions.
- Use Case: A new building toy set initially launched in five stores underperformed expectations. With early dashboard feedback, the rollout was paused before extending it company-wide saving thousands in inventory costs.