Power BI Case Study-01
Case Study with a Cycling Company
Case Study with a Cycling Company
In this fictional project, AnatoliaDev was hired by a cycling company to deliver actionable insights through data analysis using Microsoft PowerBI. We pride ourselves on providing tailored data solutions that empower businesses to achieve their goals. The objective was to track and evaluate key performance indicators (KPIs) such as sales, profit, revenue, and returns, while also uncovering trends in regional performance, product-level analytics, and high-value customers.
Understanding the Scope
The cycling company provided AnatoliaDev with raw .csv files for the following datasets:
- Transactions: Detailed records of all sales activities.
- Returns: Data on returned items.
- Products: A comprehensive catalog of the cycling company’s offerings.
- Customers: Profiles and purchase histories of customers.
- Sales Territories: Geographical data to analyze regional performance.
Our mission was clear utilize Power BI to transform these raw datasets into a cohesive and interactive dashboard that would support data-driven decision-making. The steps we had to evaluate to achieve our success was first connecting and transforming the data provided using Power BI. We imported the raw .csv files and began the transformation process. Some of the key tasks included cleaning and normalizing inconsistent data, parsing and restructuring columns for better usability and ensuring all datasets adhered to a consistent format for smooth integration.
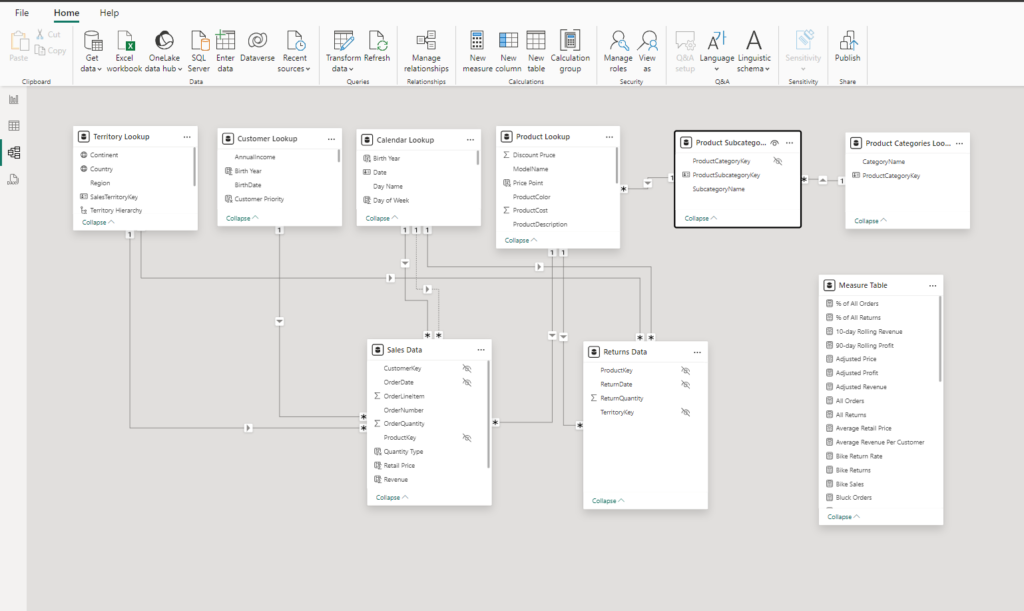
Constructing the Data Model
Up next was building a relational data model which was established between the datasets based on common keys, such as customer IDs, product IDs, and sales territory codes. A star schema was adopted to optimize query performance and maintain clarity. We created calculated columns to enhance data granularity, such as profit margins, sales categories, and product performance metrics. DAX measures were also created for total sales, average profit per product, and return rates for greater flexibility.
Designing the Interactive Dashboard
Focus Points:
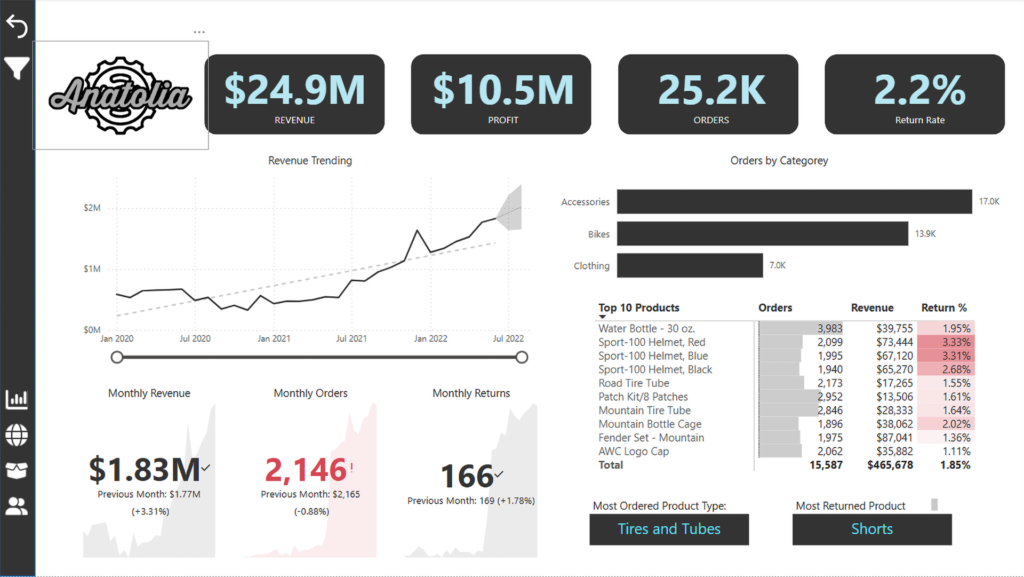
- A high-level summary of sales, profit, revenue, and returns.
- Regional performance comparison with heatmaps and bar charts.
- Product-level trend analysis, highlighting top and underperforming items.
- Identification of high-value customers using segmentation techniques.
Filters and slicers were added to enable drill-down capabilities and empower users to explore data at their convenience. The dashboard revealed a seasonal spike in sales during various months, aligning with peak cycling activity. Regional performance highlighted by a interactivemap reflected regions with untapped potential, guiding targeted marketing efforts. Product insights showedpremium products consistently outperformed others, suggesting a potential area for product line expansion. High-value customers, who accounted for a significant portion of revenue, were identified, enabling the company to tailor loyalty programs and promotions.
“The dashboard was structured to provide a comprehensive yet intuitive view of the KPIs”.
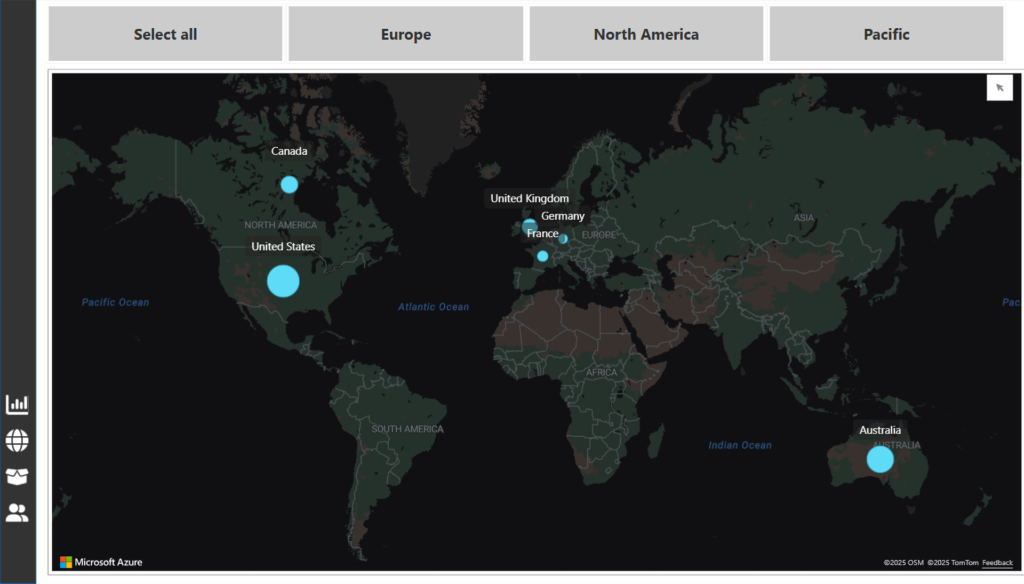
“Visualizing regional performance with interactive maps transforms complex data into actionable insights, making trends and disparities clear at a glance.”
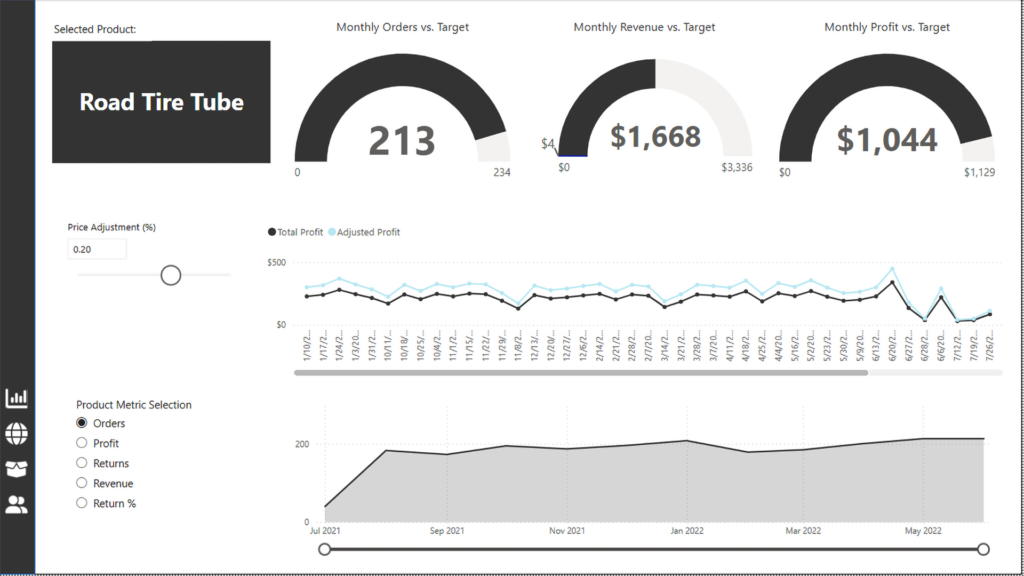
“Through detailed trend analysis, we can spotlight top-performing products and address underperforming ones, turning data into a roadmap for growth.”
This project showcased the power of data analytics in transforming raw data into actionable insights. By leveraging Power BI, AnatoliaDev was able to deliver a user-friendly dashboard that not only illuminated the cycling company’s performance metrics but also empowered them to make informed strategic decisions.
Are you looking to unlock the potential of your business data? AnatoliaDev is here to help. Contact us to learn how we can turn your data into a powerful tool for success.