Power BI Case Study-02
Toy Store Analysis (Juéguelo Toys)
Toy Store Analysis Juéguelo Toys
At AnatoliaDev, we recently had the opportunity to collaborate with a growing toy store chain based in Mexico. With multiple retail locations and a wide range of products, the client reached out to us with a clear objective: “They wanted a better way to monitor their business performance and make data-driven decisions.”
“Note: All data shown has been anonymized and modified to protect the identity and confidentiality of the client.“
The Challenge
The client provided a rich dataset consisting of transactional records from January 2022 through September 2023, detailed product-level information across multiple categories, and stores covering various locations throughout Mexico. While the data was extensive and valuable, it lacked structure and cohesion. The datasets arrived in siloed formats (typically CSVs exported from different systems) without a unified schema or data model. As a result, the leadership team was unable to extract insights efficiently or consistently. Generating even basic reports requires manual effort, leaving decision-makers with lagging, fragmented views of business performance.
Our Approach
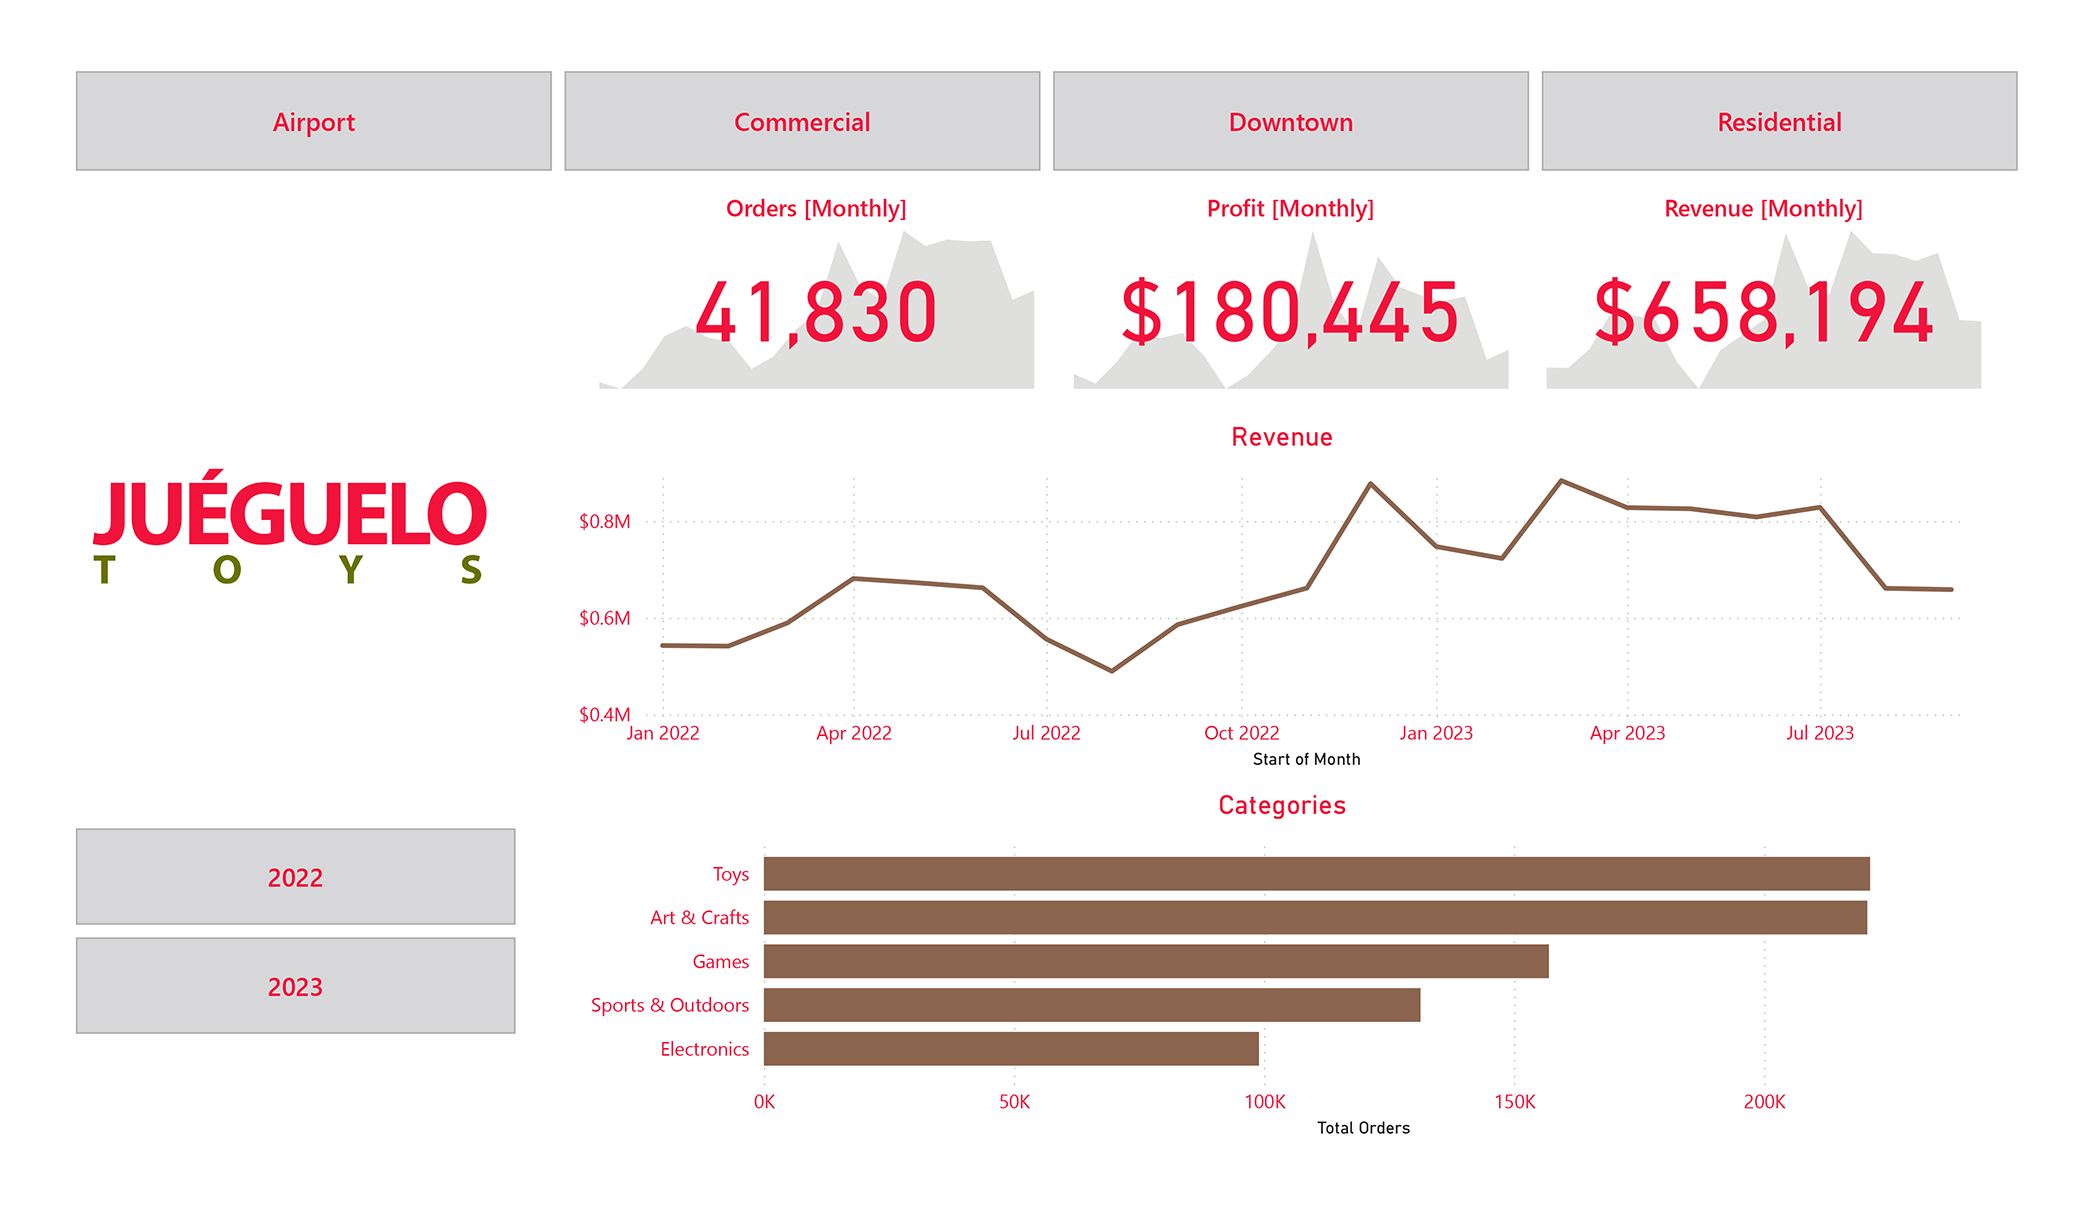
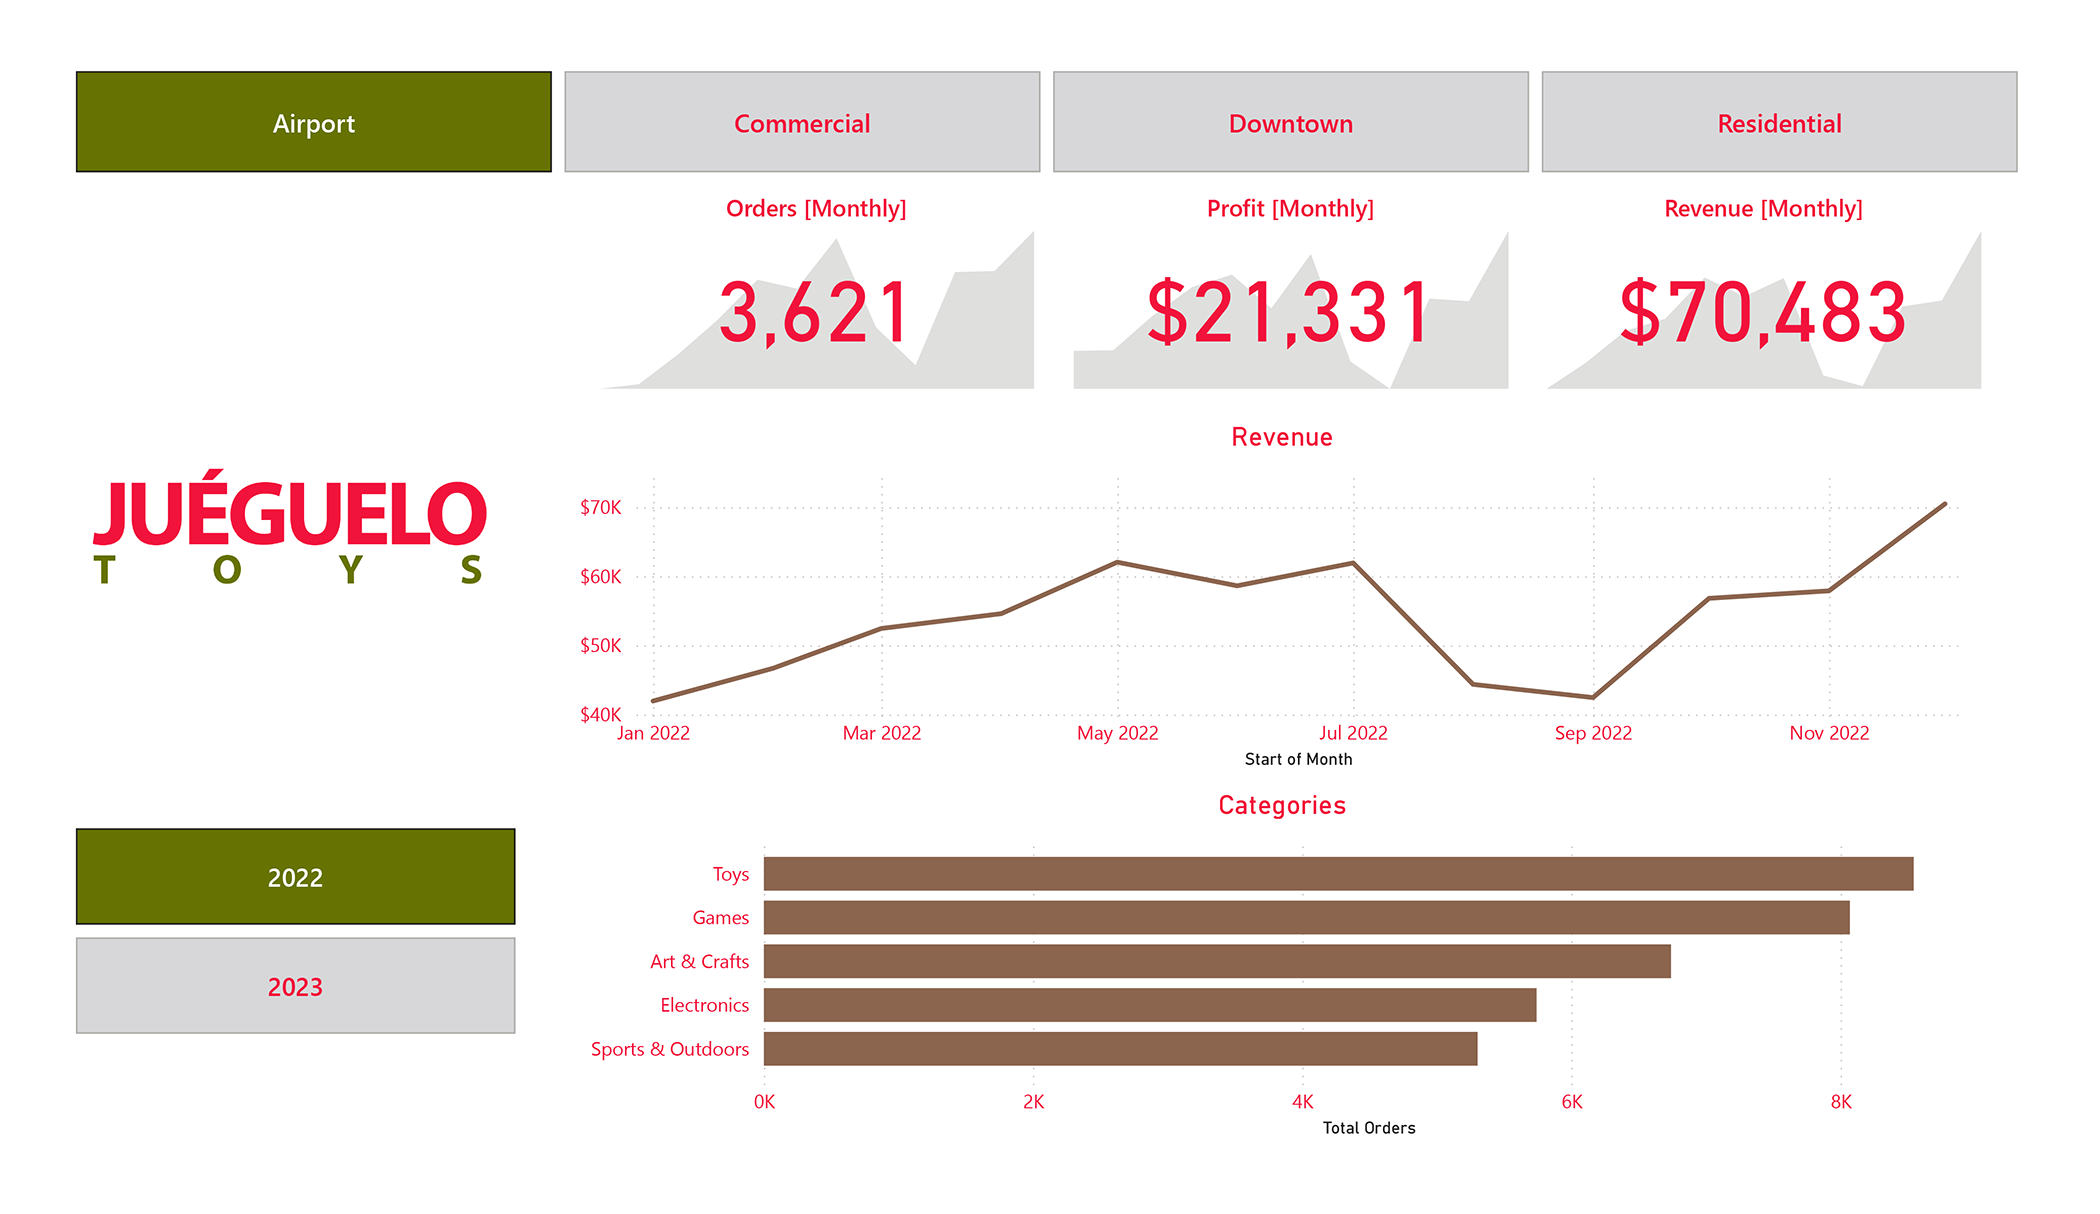
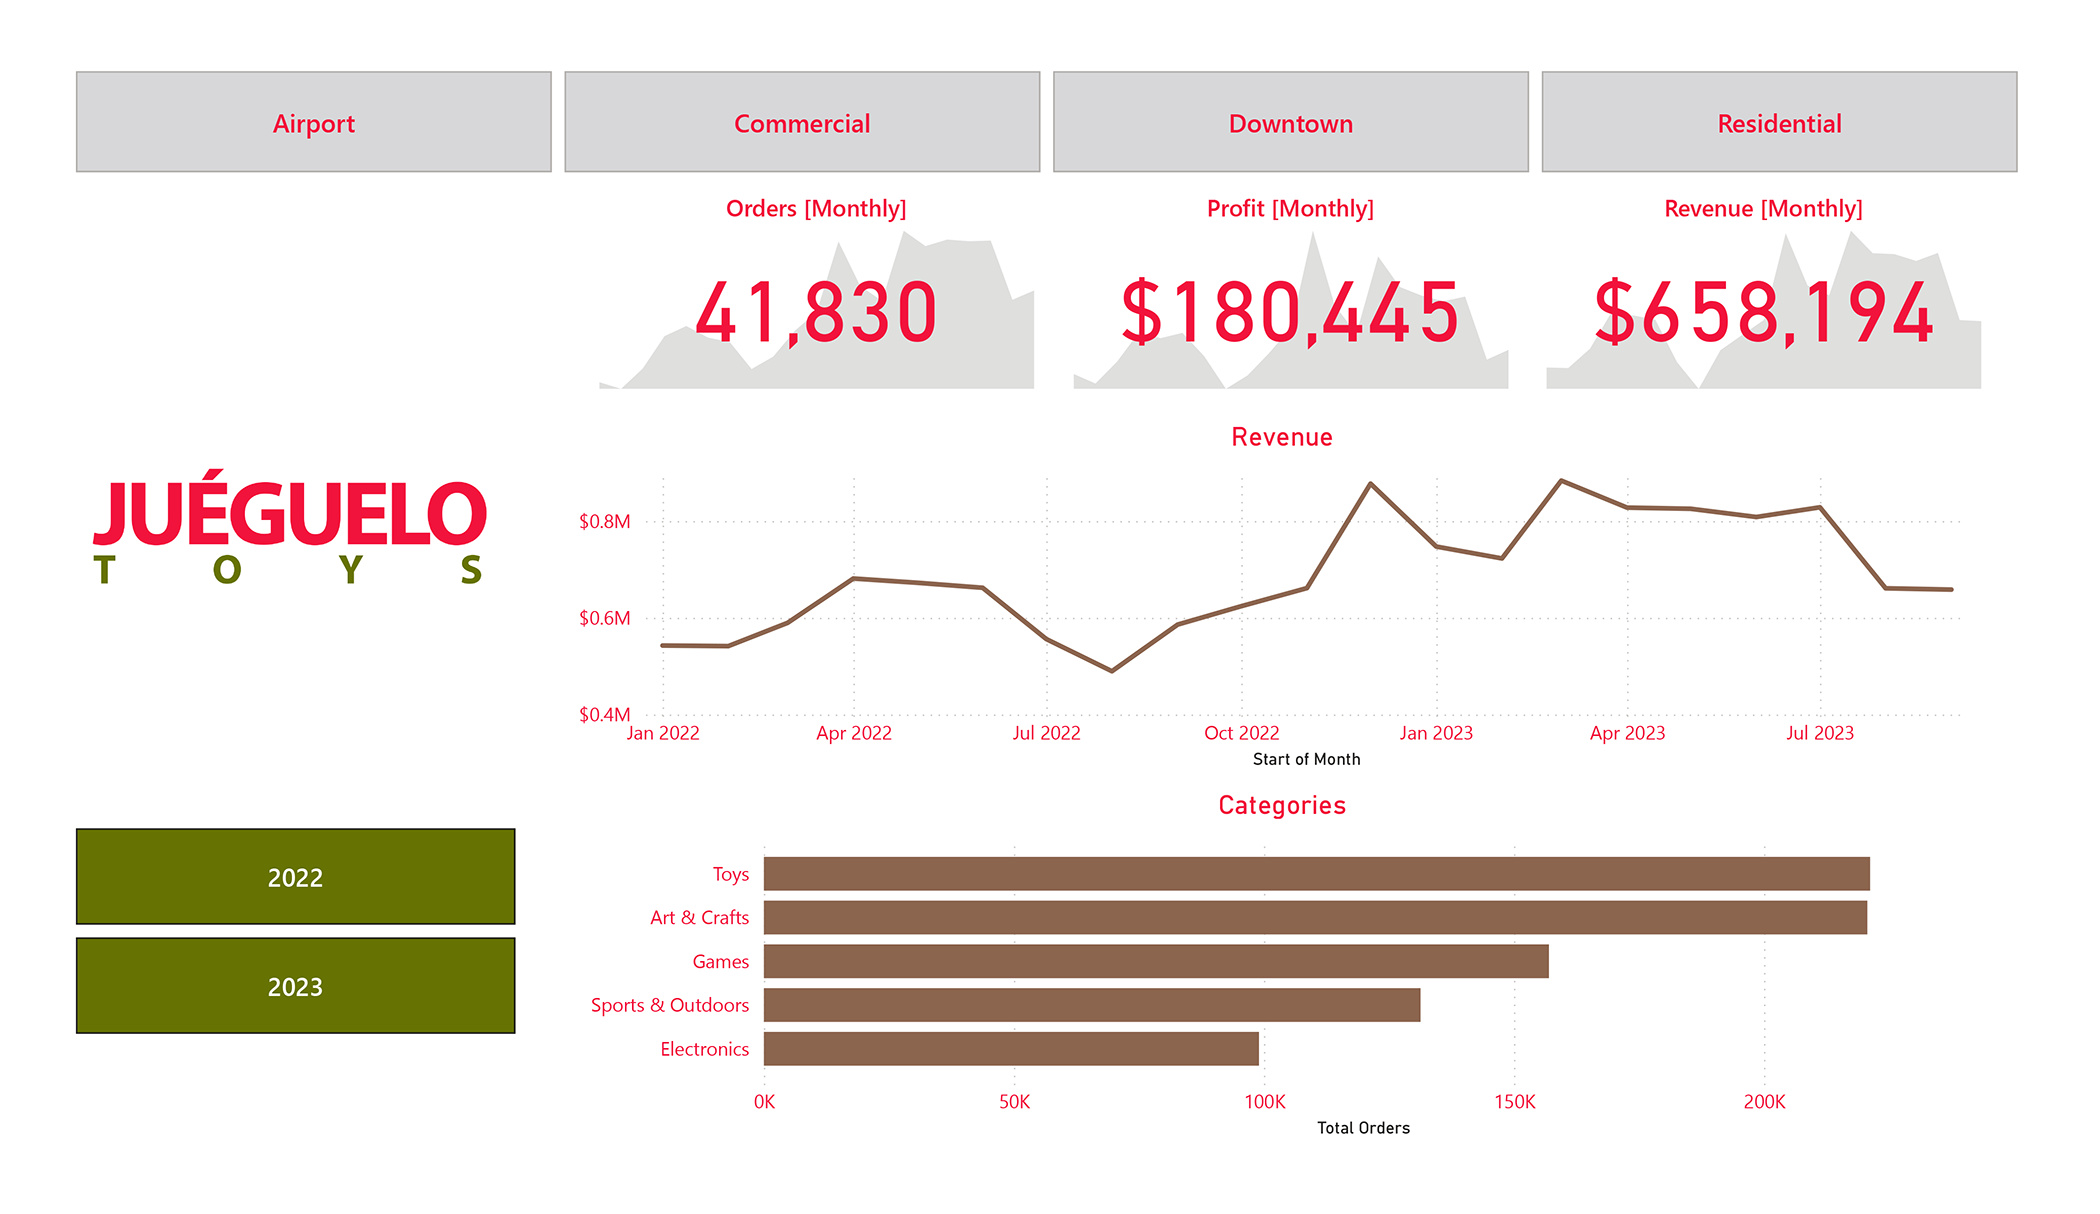
Our solution is centered on designing a clean, interactive dashboard in Power BI that could serve both executive and operational leadership needs. We began by cleaning and transforming the data using Power Query, constructing a star schema that connected fact tables (transactions) with dimension tables (stores, products, calendar), enabling efficient aggregation and filter logic. From there, we developed dynamic visualizations to track sales trends, detect seasonal fluctuations, and enable cross-comparisons between stores, cities, and regions.
We also built metrics to highlight top-performing product categories while including interactive slicers for period, location and allowing users to explore data from multiple perspectives with minimal effort. Emphasis was placed on intuitive design, responsive load times, and future scalability, making it easy for both technical and non-technical users to adopt the solution.
Results
The final was a centralized, interactive reporting tool that gave the client visibility into their retail operations. The leadership team could now assess individual store performance, evaluate category-level sales trends, and identify gaps or opportunities in real time. Inventory planning became more data-driven, with clear insights into what was selling where and when. The dashboard also eliminated hours of manual work previously spent building static reports in Excel. The feedback was highly positive executives reported increased confidence in their decision-making process, and the organization as a whole gained a clearer, data-backed understanding of its growth trajectory. We’re proud to have supported this transformation and look forward to the continued evolution of their BI strategy.
Whether you’re running a local store or a multinational chain, the ability to visualize your data can unlock smarter decisions. If your business is still working off spreadsheets and static reports, AnatoliaDev can help you build interactive tools tailored to your unique goals.